 Éric Marty | @allopole
How much oil was that?
Timeline:
-Apr 20: Rig explodes
-Apr 22: Rig sinks
-Jul 15: Well capped
-Sep 19: Well sealed
5 years ago, in 2010, the Deepwater Horizon drilling platform in the Gulf of Mexico exploded when a pulse of high-pressure methane gas from the 1500m deep Macondo wellhead expanded into the drilling riser and rose into the drilling rig. The resulting oil spill was the largest accidental marine oil spill in history.
The quantity of oil released — 4.9 million barrels (206 million gallons)1 — is difficult to grasp. To try to wrap my head around what that volume of oil looks like, I first represented it as an oil storage tank roughly 27m (85ft) in diameter like these…
![]() View of Chevron crude oil depot, Richmond CA. Josh Cassidy/KQED. (Appologies to Chevron --- The Gulf spill was BP's accident. Chevron's tanks are only used in this article to show scale.)
View of Chevron crude oil depot, Richmond CA. Josh Cassidy/KQED. (Appologies to Chevron --- The Gulf spill was BP's accident. Chevron's tanks are only used in this article to show scale.)
…but 1500m high (nearly a mile). That’s the depth of the wellhead. There is no oil tanker in existence that could contain all that oil, though the now scrapped super tanker “Seawise Giant” could have held most of it.

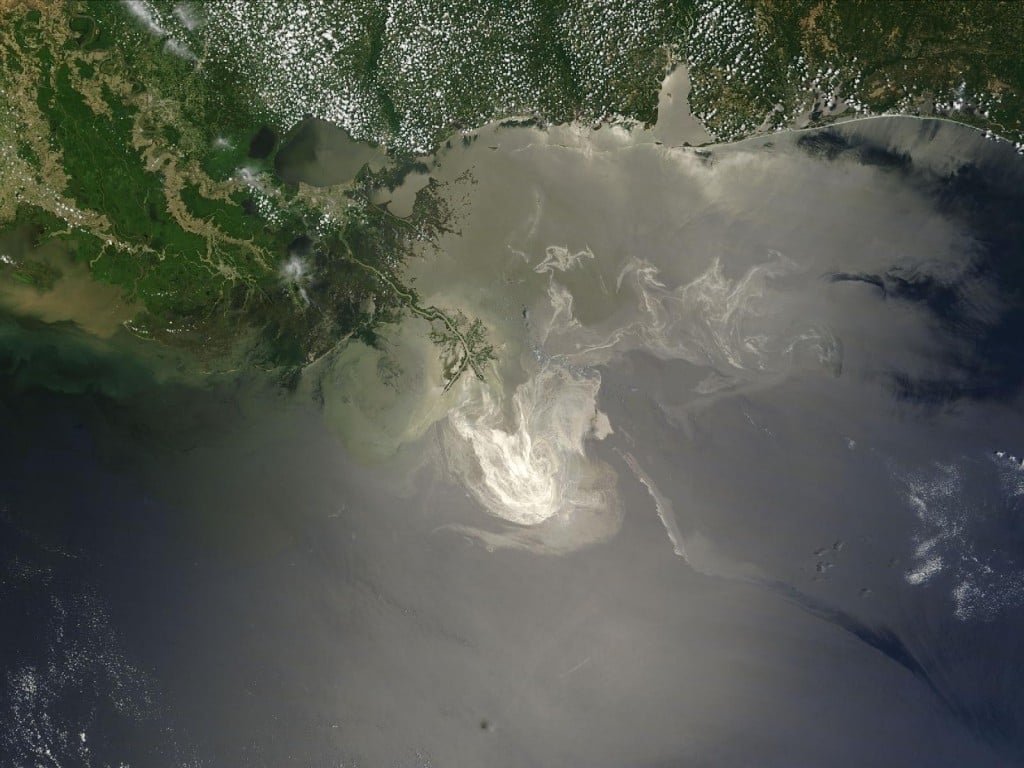 Deepwater Horizon oil slick, in a May 2010 NASA image
Of course, the spill didn’t look like that. About half of the oil spread accross the surface as a slick, and half spread out in a deepwater plume2, never reaching the surface but impacting the water column and ocean bottom. However, an intuitive feel for the quantities can us help to begin to understand the impact of the spill.
Natural oil and gas seeps in the Gulf
ECOGIG studies the effect of natural hydrocabon seeps on the Gulf ecosystem, and compares them with the effects of large accidental releases.
The Gulf of Mexico is well known as an oil reservoir, and like other ocean oil reservoirs, the Gulf features thousands of naturally occuring seeps that release small quanitites of oil and gas into the ocean on a continual basis. One might think that since the Gulf ecosystem has evolved to cope with these natural hydrocarbon releases, the impact of oil spills would be small (or at least reduced). But to understand the relationship between natural and accidental hydrocarbon releases in the Gulf, we need to begin by inderstanding the differences in scale.
 1 barrel (42 gallons)
A very active natural oil seep in the Gulf of Mexico can put out around 1 barrel of oil per day and looks like this:
 Surface sheen above a natural oil seep in the Gulf of Mexico. Photo by Beth Orcutt.
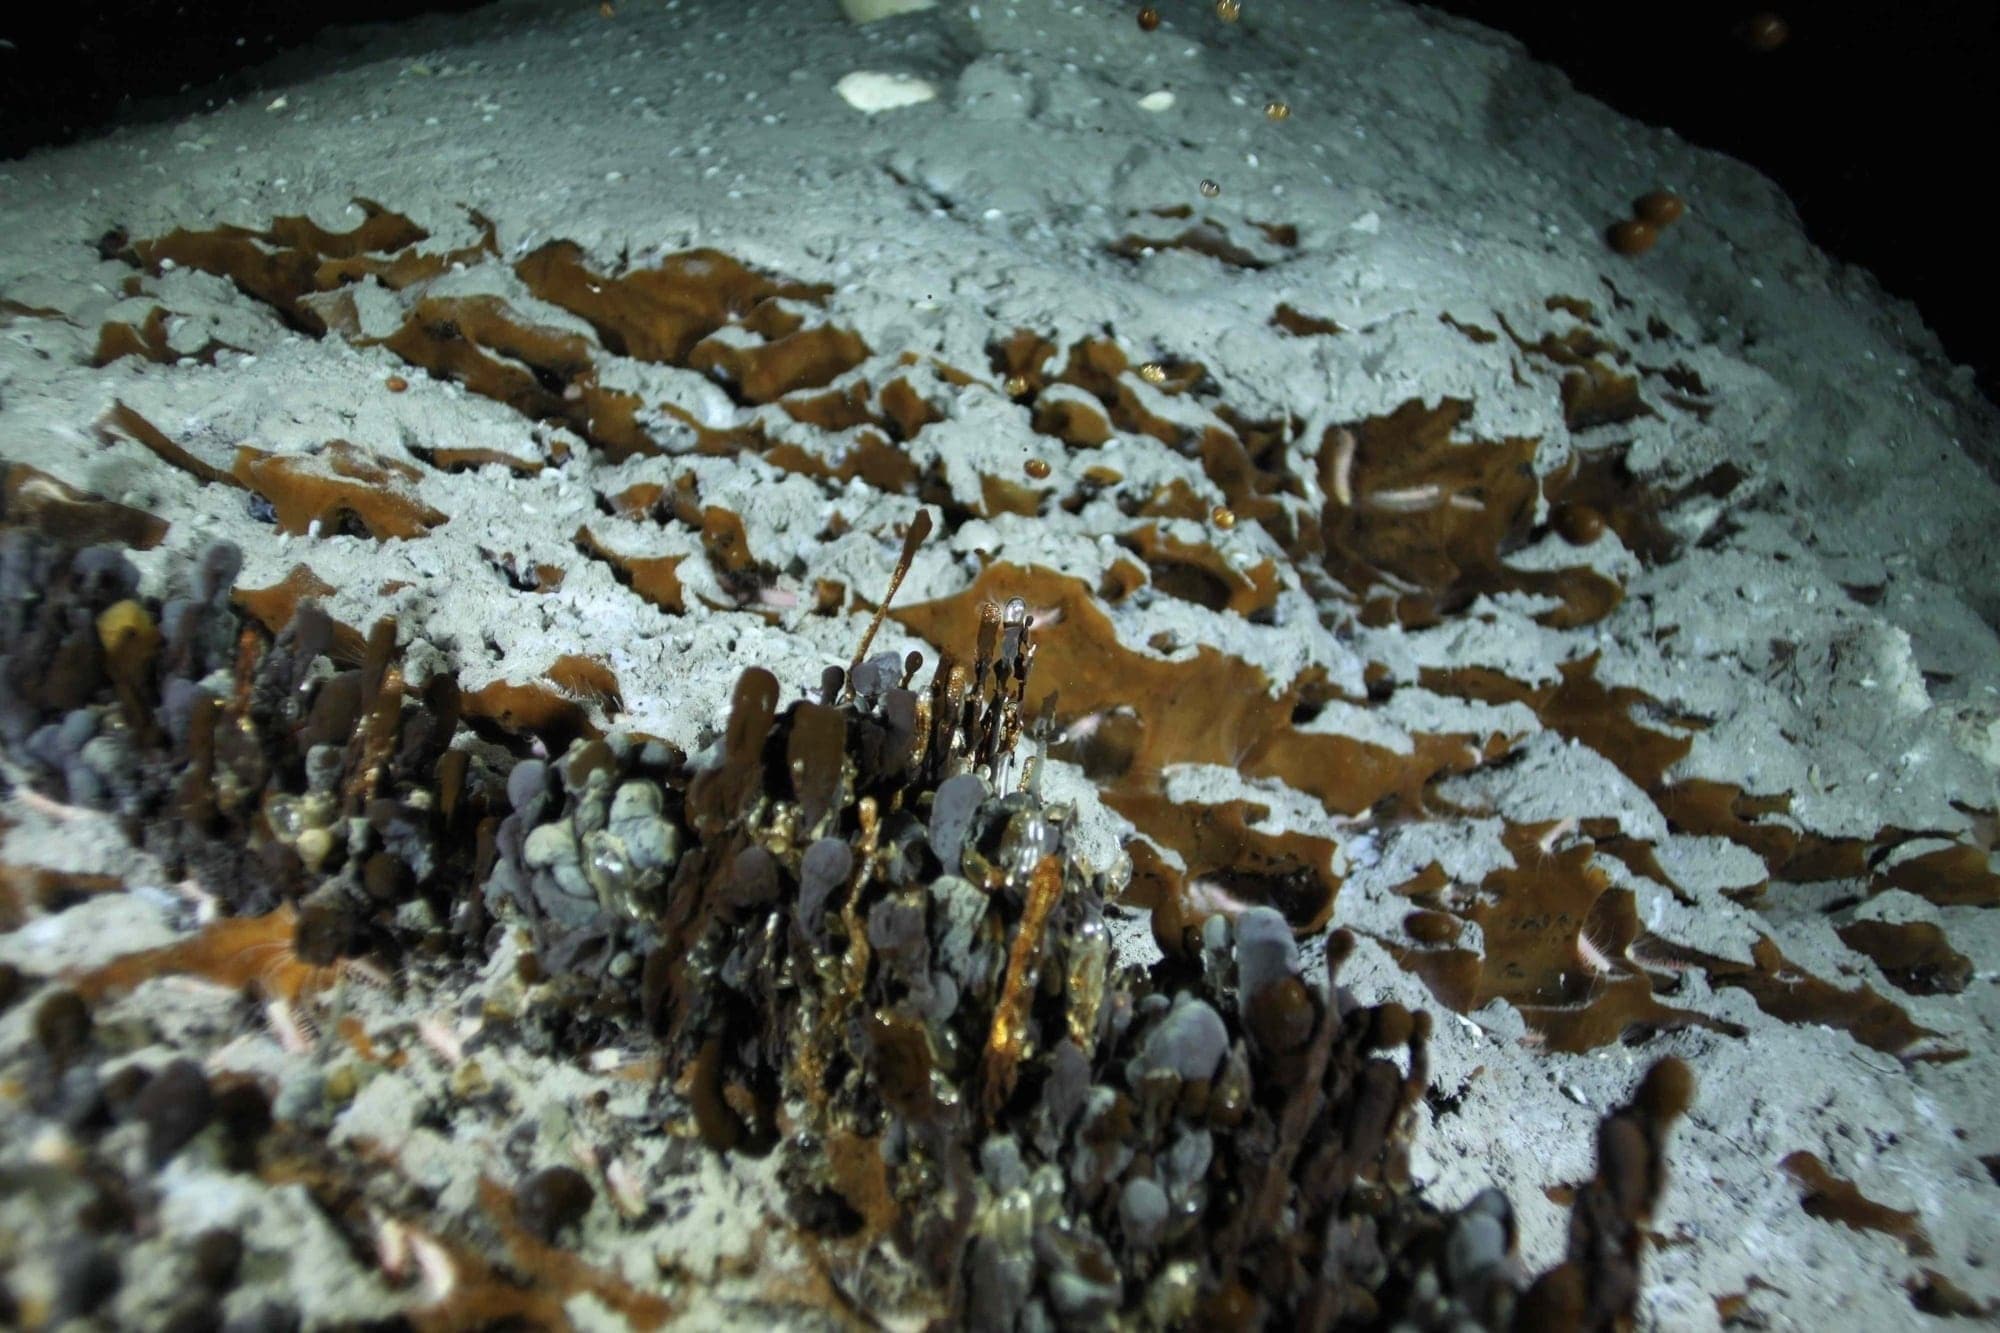 Natural oil seep in the Gulf of Mexico. Photo ECOGIG
There are something like 20,000 seeps in the Gulf but most put out much less that one barrel per day. The total daily output of all the seeps in the Gulf is not well constrained, but a “reasonable” estimate based on extrapolation from looking at small areas would be from 2500 to 10,000 barrels per day.34
 The large tanks in the background at left, some of the largest ever built, are 88m in diameter and hold 750,000 barrels each. A 747 could park comfortably inside.
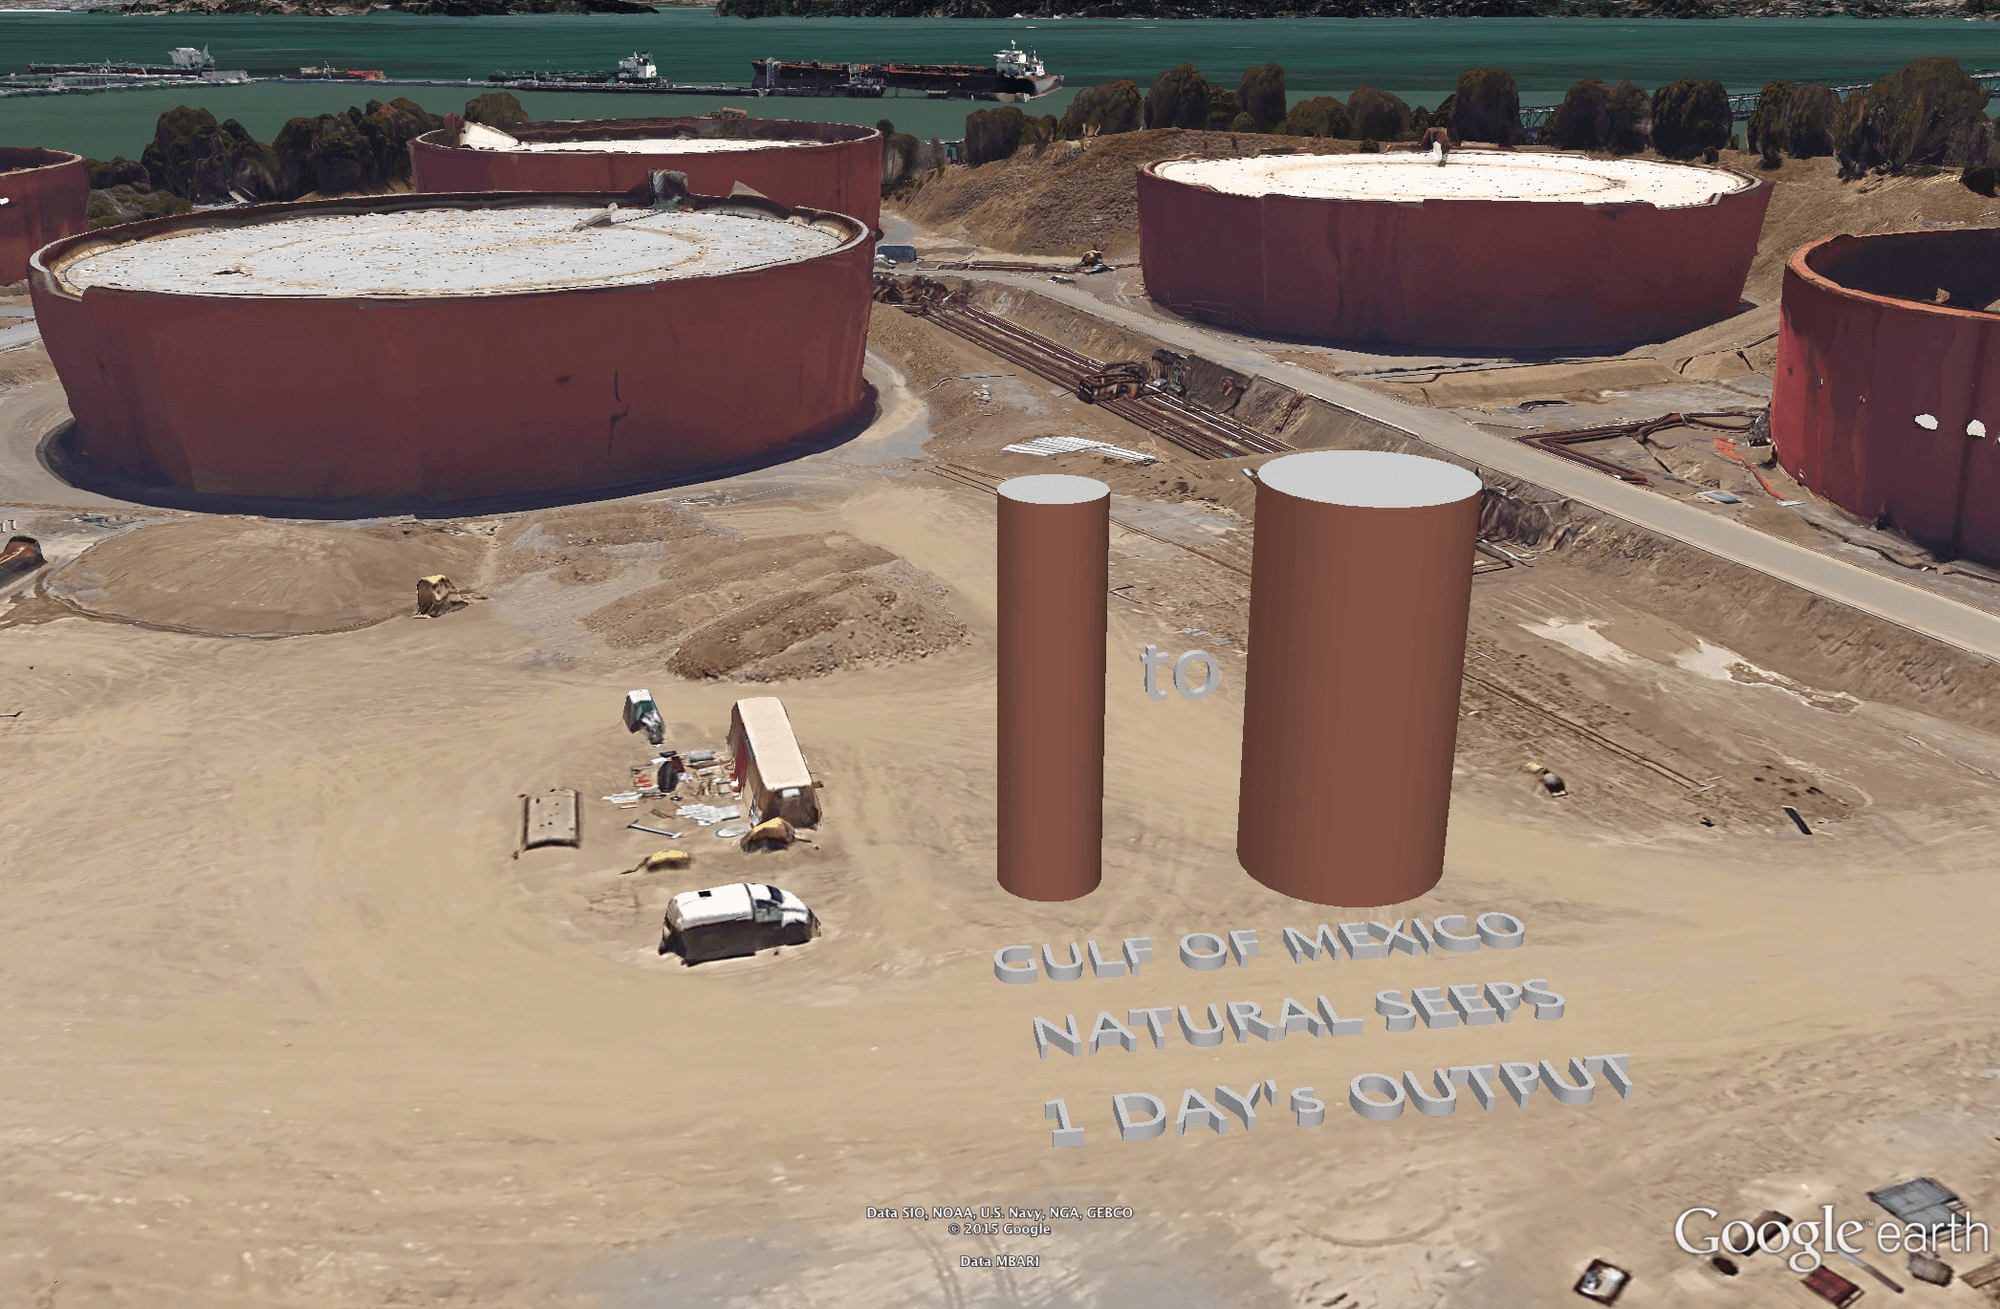 One day's output from all 20,000 natural oil seeps in the entire Gulf of Mexico (2500 to 10,000 barrels) would fill a hypothetical tank 19.6m (64 ft) high and 5 to 10 meters (16 to 32 ft) in diameter. *The large tanks in the background hold 750,000 barrels and would comfortably fit a 747 inside.
By contrast, the Macondo wellhead spilled from 57,000 to 70,000 barrels per day from a single point source. It would take from 1 to 4 weeks for the output of all the natural seeps in the gulf to equal one day’s output from the macondo wellhead.
 Or you could flood the passenger and cargo holds of 8.75 to 10.75 Boing 747s
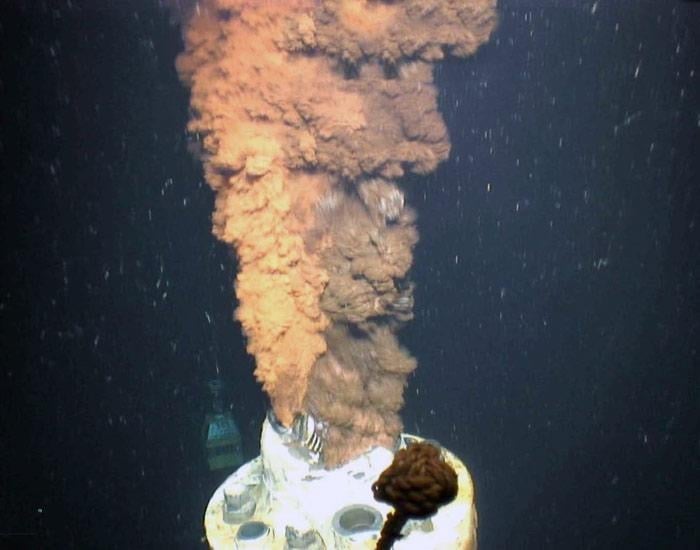 Macondo wellhead spewing oil and gas. Photo credit: U.S. Geological Survey
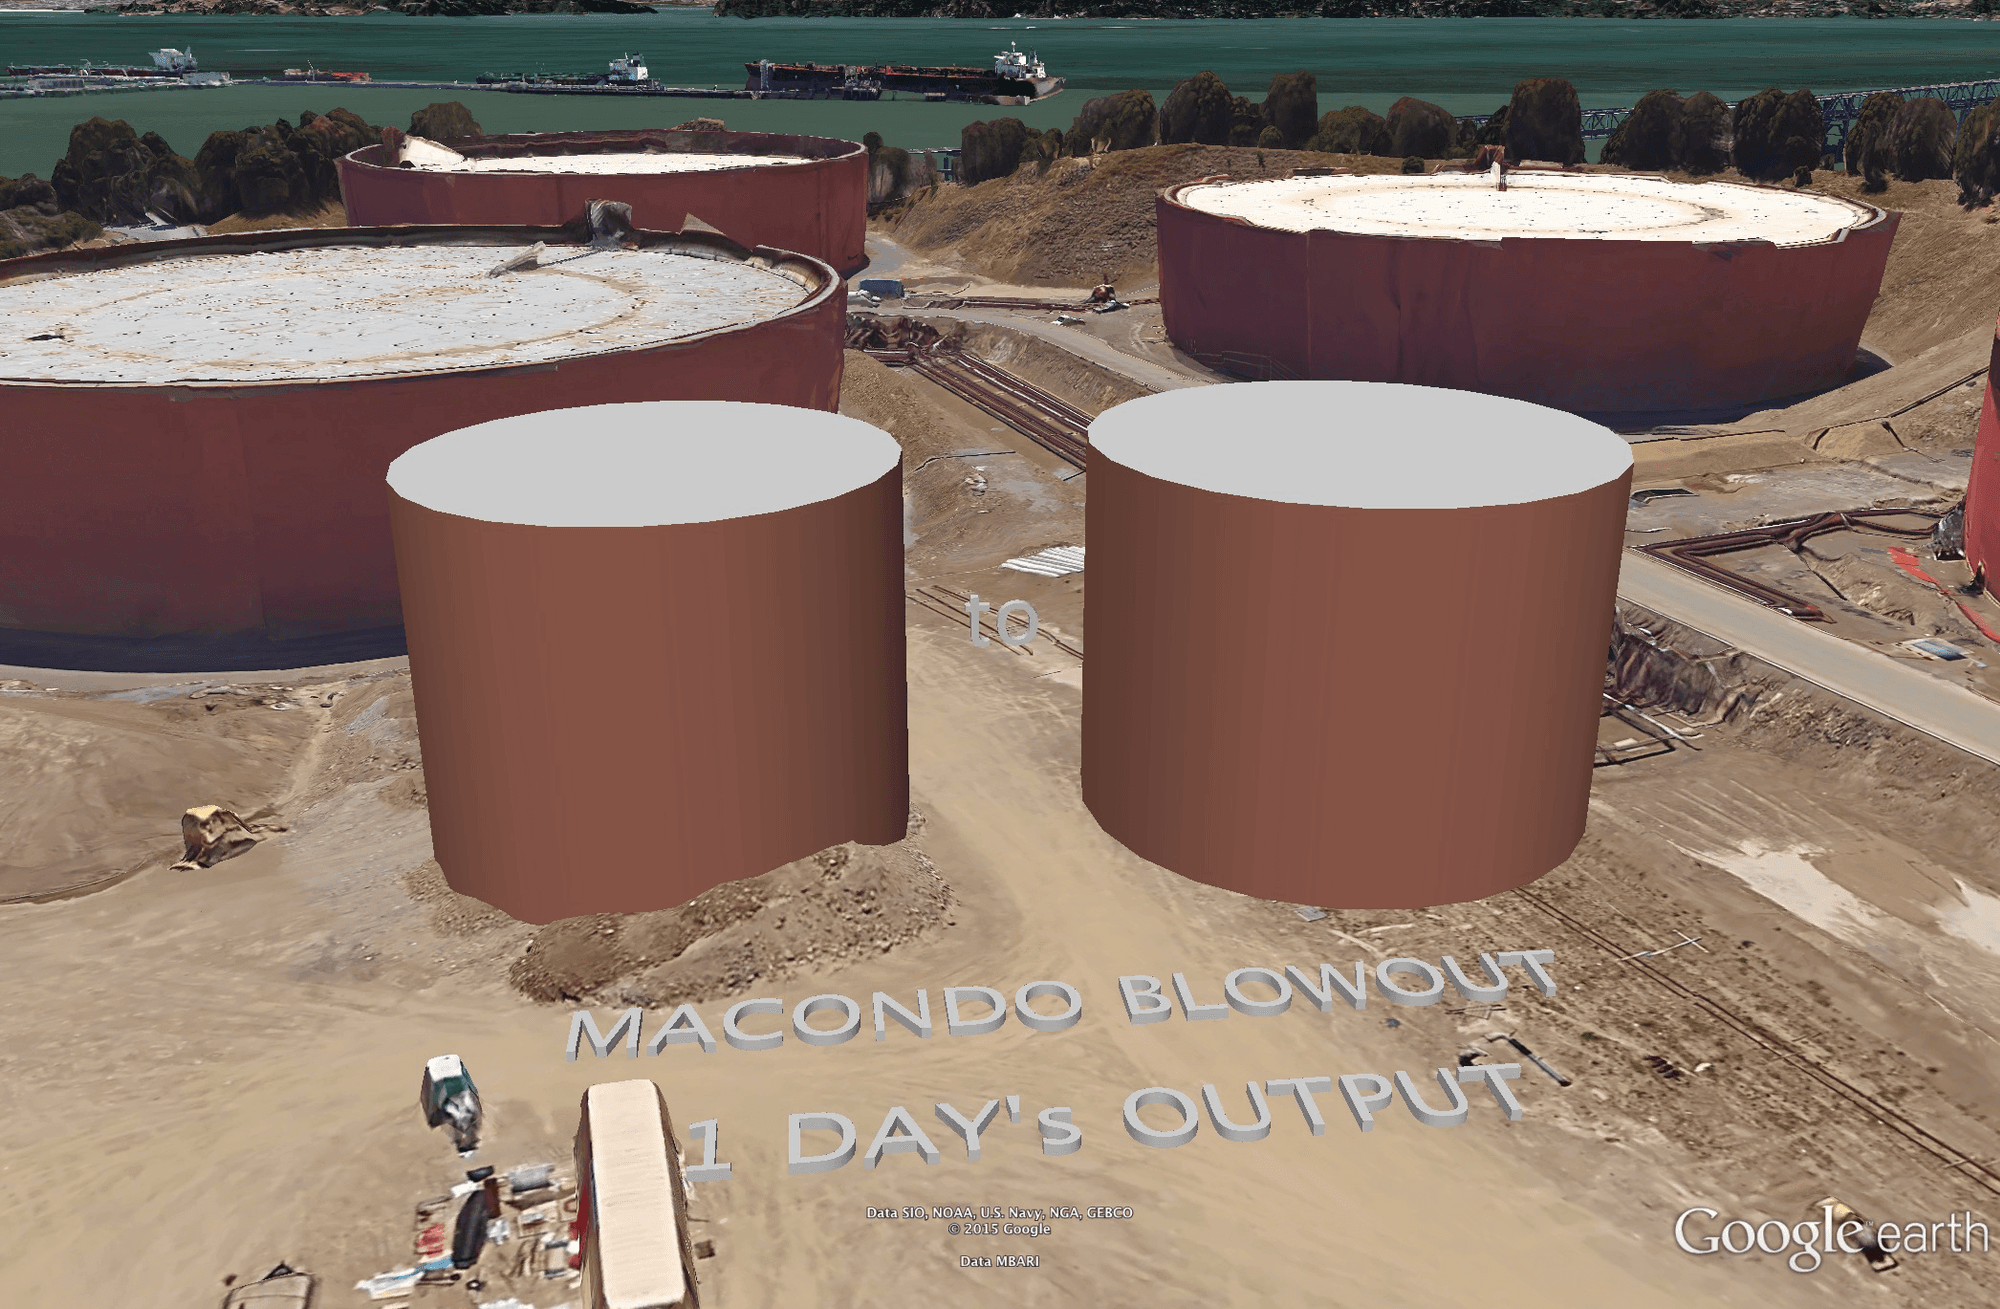 One day's output from the Macondo wellhead blowout would have filled a hypothetical tank the same height (19.6m or 64 ft) but 24 to 27 meters (80 to 88 ft) in diameter.
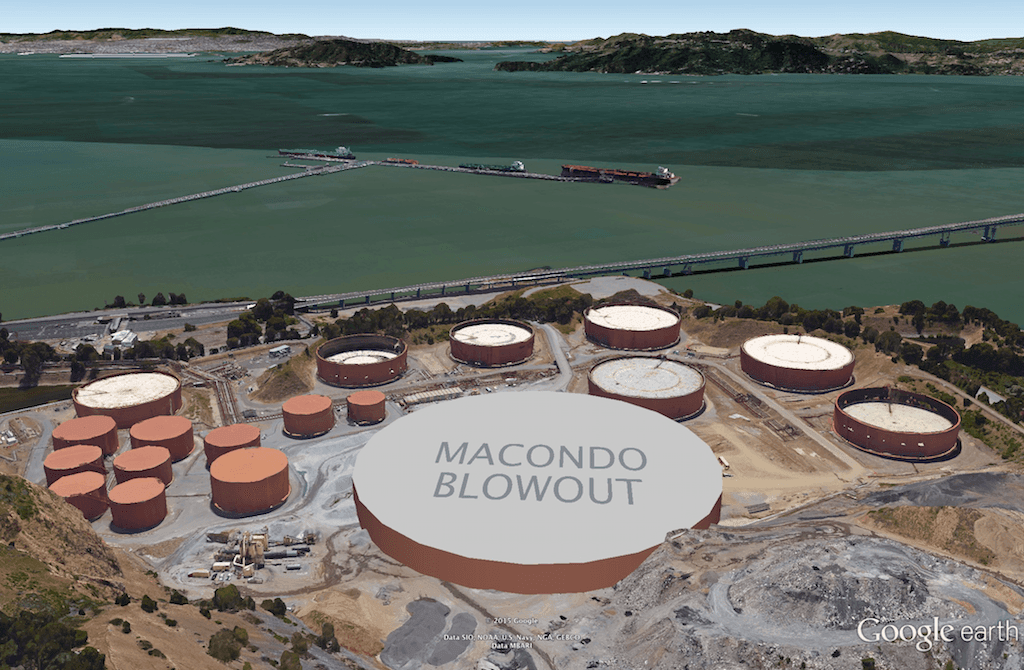
1 day’s output would fill a giant 88m diameter storage tank in 11-13 days. The wellhead discharged oil continually for 86 days, outputting 4.9 Million Barrels. It would take all the storage tanks in the field below to contain that oil:
![]() Section of the Chevron Richmond Refinery. These tanks are used to store crude oil offloaded from oil tankers. the tanks on the right are the ersatz 747 hangars.
Section of the Chevron Richmond Refinery. These tanks are used to store crude oil offloaded from oil tankers. the tanks on the right are the ersatz 747 hangars.
Or, one might construct a single storage tank 6 stories tall and nearly 2 1/2 football fields in diameter.
 This hypothetical storage tank, too large to ever be built, is 19.6m high and 225m in diameter.
To sum up the comparison of natural vs. accidental oil releases in the Gulf of Mexico, let’s look at those quantities side by side.

You can read more about the Deepwater Horizon spill and its effects on the Gulf ecosystem at ecogig.org.
If you’d like to explore the visualizations in this article yourself in Google Earth, download the KMZ files below. Double click on the .kmz files and they will open in Google Earth.
seeps.kmz
macondo-daily.kmz
macondo-widetank.kmz
Marcia K. McNutt et al., “Review of Flow Rate Estimates of the Deepwater Horizon Oil Spill,” Proceedings of the National Academy of Sciences 109, no. 50 (December 11, 2012): 20260–67, doi:10.1073/pnas.1112139108. Accessed August 11, 2015. http://www.pnas.org/content/109/50/20260.full↩
McNutt et al., p. 20267↩
I. R. Macdonald et al., “Natural Oil Slicks in the Gulf of Mexico Visible from Space,” Journal of Geophysical Research: Oceans 98, no. C9 (September 15, 1993): 16351–64, doi:10.1029/93JC01289↩
Joye, Samantha B., e-mail message to author, June 30, 2015.↩